Mapping the invisible: how coverage mapping uncovers interference areas

Ever dropped a call at the most inconvenient moment? Or struggled to get service with a sluggish radio connection despite being at "full bars"? In many cases, these frustrating experiences stem from unseen interference impacting the radio connection’s quality of service (QoS), reducing uplink coverage, and degrading the end user’s quality of experience (QoE).
Beyond the bars: unveiling interference
Precious radio frequency (RF) spectrum is susceptible to various types of interference, causing disruptions to radio connections and hindering network performance. To deliver the best possible service, operators must frequently monitor RF spectrum to identify and eliminate this interference.
Spectrum monitoring is a complex task
Monitoring the radio network spectrum is a deceptively complex task. While it may seem straightforward on the surface, it often requires:
- Experienced professionals: To interpret the vast amount of data collected during spectrum monitoring, these professionals should be experts in radio propagation analysis with a clear understanding of spectrum allocation and behavior of interference sources.
- Sophisticated procedures and advanced tools: In fact, effective radio spectrum monitoring involves mastering complex procedures and heavy tools along with best practices to ensure accurate data collection and analysis.
Specialized equipment like spectrum analyzers is essential for capturing and interpreting the intricacies of the radio frequency spectrum by calculating the channel power on suspected areas, yet false positives often occur. So how can operators be certain that they’ve correctly identified the areas experiencing interference?
EXFO’s coverage mapping of channel power: a game changing way to identify potential interference areas (or zones) quickly and easily!
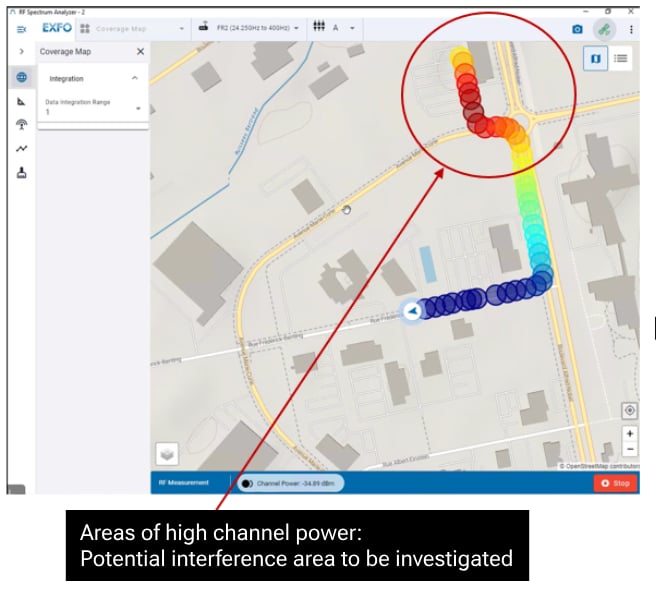
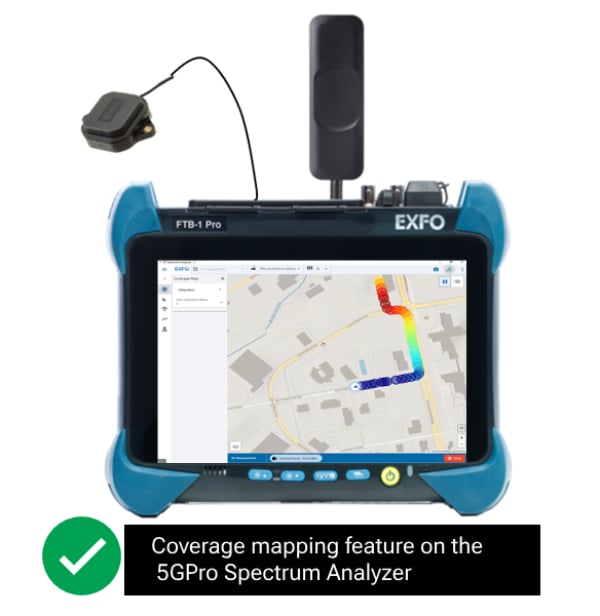
Coverage mapping of channel power on EXFO's RF spectrum analyzer, the 5GPro Spectrum Analyzer, offers an efficient and easy way to continuously measure and paint a detailed visual picture of channel power and power spectral density (PSD) on a map. By doing so, the cell tech or RF engineer who drives or walks with the 5GPro Spectrum Analyzer can leverage the collected data to create a heat map. In this heat map, hotter zones represent areas with stronger channel power concentration, indicating where potential unwanted signals are emitting alongside normal operator signals. The true power lies in what this reveals: potential interference.
In fact, multiple transmitters operating on the same channel can create a chaotic mess, leading to dropped calls, handover and call failures, and data throughput degradation. Also, faulty equipment or unauthorized devices can bleed over, disrupting desired channels with unwanted emissions. Coverage mapping can highlight these problematic areas, making troubleshooting more targeted and consequently faster.
First, by understanding the interference situation in the field using the coverage mapping for channel power feature, network operators can identify problem areas. Then they can use directional antennas to pinpoint and hunt the exact direction or location of the interference. Lastly, once they know the area in question, they can negotiate with neighboring networks to eliminate unwanted emissions, replace faulty equipment and prevent unauthorized devices from emitting in their network.
A clearer vision for a stronger network
Coverage mapping streamlines interference detection for network operators. By visually pinpointing problem areas on a map, it reduces the need for extensive field testing, thereby saving time and empowering proactive network maintenance and troubleshooting, ultimately leading to a seamless and frustration-free user experience.
So, the next time you encounter a dropped call, remember, the answer might lie not in the bars on your phone, but in the invisible world unveiled by coverage mapping.
The 5GPro Spectrum Analyzer, including coverage mapping, is available on the FTB 5GPro, EXFO’s complete all-in-one 4G and 5G test solution designed to streamline field operations when deploying 4G/LTE and 5G wireless networks.